Making strategic choices for growth
Download our latest whitepaper and discover strategies used by top-performing credit unions to accelerate loan growth, improve return on assets (ROA) and enhance member engagement.
This comprehensive research delves into the strategic choices of credit union performance leaders in loan growth, membership growth and ROA. Gain insights into their key similarities and differences to help inform your credit union’s future strategies.
Definition of growth leader
Credit unions in the top 1/3 tier of loan growth, membership growth or ROA performance as defined below.
Loan growth leader
2020-23 Compound annual growth rate (CAGR) greater or equal to 12.7%
Member growth leaders
2020-23 CAGR greater or equal to 3.3%
Return on assets leader
Q3 2023 ROA greater or equal to
92.5 basis points
Key strategic differences among growth leaders
All three types of leaders tend to prioritize agility and adaptability.
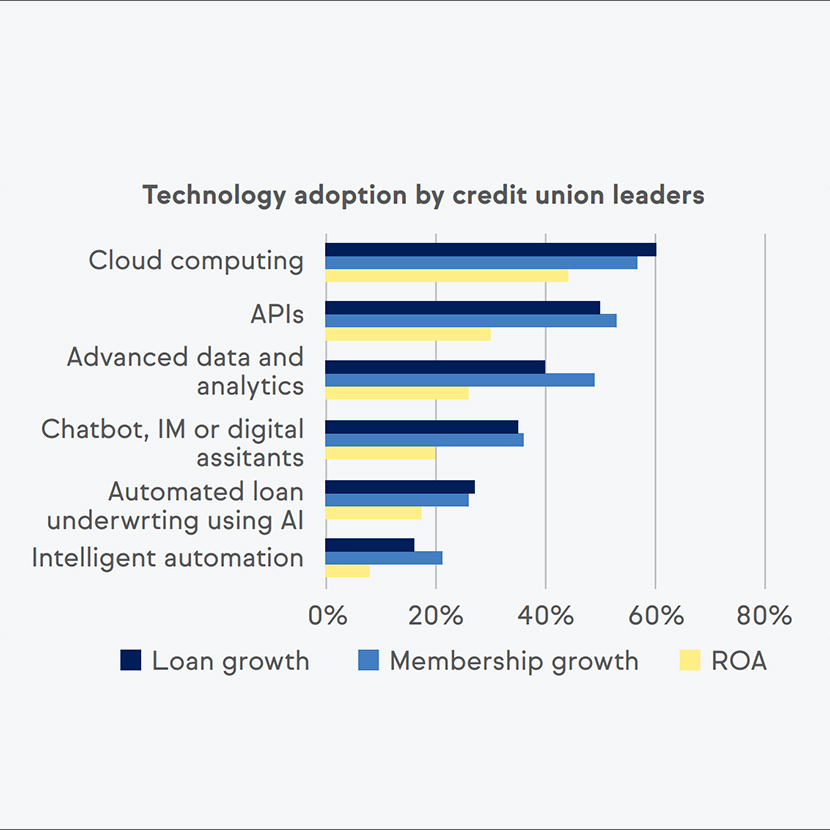
Digital adoption
Loan and membership growth leaders are more likely to adopt advanced digital technologies compared to ROA leaders.
Strong community presence
Membership growth leaders are significantly more likely to cite strong community presence as a key competitive advantage compared to the bottom 1/3.
Importance of branches
Loan growth leaders are no more likely than those in the bottom 1/3 to consider branches a top distribution channel. By contrast, membership and ROA growth leaders are more likely to consider branches as a top distribution channel than the bottom 1/3.

All lending leader types tend to prioritize agility and adaptability
Having an agile and adaptable culture enables top-performing
credit unions to:
- Respond to change
- Better meet member needs
- Innovate
- Manage risk
- Retain satisfied employees
- Optimize processes
- Foster a culture of continuous improvement
About research and authors
Author: Steve Heusuk
Director of Competitive & Marketing Intelligence, TruStage®
Every year, TruStage partners with credit unions to explore market trends, uncovering valuable insights that shape our understanding of the marketplace. Making Strategic Choices for Growth research explores the strategic choices of credit unions in the top third for loan growth, membership growth, and ROA. It provides actionable insights for credit unions looking to enhance their strategies and drive growth.